The Fastest Internet Providers in 2023
May 31, 2023 | Share ![]()
![]()
![]()
Brand Guides, Featured, Internet Speed Guides
-
Fastest overall
 Google Fiber
- Price: $70.00–$100.00/mo.*
- Advertised speeds: 1,000–2,000Mbps
- Integrated speed score (ISS): 176.16
-
 Verizon Fios and 5G Home Internet
- Price: $49.99/mo.–$119.99/mo.†
- Advertised speeds: 300–2,300Mbps
- Integrated speed score (ISS): 160.37
-
 Xfinity
- Price: $19.99–$80.00/mo.‡
- Advertised speeds: 75–1,200Mbps
- Integrated speed score (ISS): 158.68
-
 Cox
Cox- Price: $49.99–$99.99/mo.§
- Advertised speeds: 100–1,000Mbps
- Integrated speed score (ISS): 150.40
-
 Metronet
- Price: $29.95 - $120.00/mo║
- Advertised speeds: 100 – 5,000Mbps
- Integrated speed score (ISS): 150.32
Read disclaimers.
Millions of netizens take HighSpeedInternet.com’s speed test each year, and the results give us a comprehensive view of how internet speeds have been shaped by industry developments, technological advancements, and the global COVID-19 pandemic.
In this report, we draw on our speed test results to highlight the fastest internet providers in the United States in 2023. We also draw on our data to look at how many US-based internet users get speeds of 100Mbps or faster on their home internet. With those insights, our report shines a light on whether America is ready for a new benchmark for broadband performance proposed by the Federal Communications Commission.
We’ve broken up this report into two sections. Each section addresses a key question:
Part 1: What are the fastest internet providers right now?

The section below looks at which internet providers deliver the fastest speeds and just how fast those speeds are.
Google Fiber is the fastest internet provider, followed by Verizon and Xfinity
Let’s get right to the point: Google Fiber is the fastest internet provider in the United States.
Among national internet providers (which we define as serving five states or more), Google Fiber delivers the fastest average speeds to its customers on the most consistent basis, earning an integrated speed score (ISS) of 176.16. Google Fiber offers maximum advertised speeds up to 2,000Mbps and reached average download speeds of 176.19Mbps over the past 12 months.
Though it’s available in only 19 cities, Google’s flagship fiber-optic service has been the fastest internet provider since 2018, handily beating out all competitors every year. And soon it may see bigger gains as it unrolls new plans advertising 5,000Mbps and 8,000Mbps speeds.
But other providers have also shown impressive scores. Verizon is the second-fastest internet provider, with max advertised speeds up to 1,200Mbps and an ISS of 160.37. Xfinity, Cox, and Metronet take third, fourth and fifth place, respectively.
Fastest national internet providers, April 2022–April 2023
| Rank | Provider | Integrated speed score (ISS) | Max advertised speed | Order online |
|---|---|---|---|---|
| #1 | | 176.16 | 2,000Mbps | |
| #2 | | 160.37 | 1,500-2,300Mbps | |
| #3 |
| 158.68 | Up to 1,200Mbps | View Plans |
| #4 |
| 150.40 | 1,000Mbps | View Plans |
| #5 |
| 150.32 | 5,000Mbps | View Plans |
*Data effective 5/8/2023. Data taken from internet user results conducted on HighSpeedInternet.com’s speed test between April 1, 2022 and April 1, 2023. Not all speeds and packages available in all areas and are subject to change. The weighted speed score is not an actual internet speed.
Want to see if you can get the fastest internet providers in your area? Run a search with our zip code tool to find out.
Altamaha Fiber takes the lead among regional internet providers
While major providers like Verizon Fios and Xfinity bubbled to the top of the list of fastest nationwide providers, several regional and local providers also distinguished themselves with fast speeds.
Over the past 12 months, the fastest regional provider (meaning any provider that serves fewer than five states) is Altamaha Fiber. That’s according to results from our speed test tool taken between April 1, 2022, and April 1, 2023.
Based out of Lyons, Ga., Altamaha is a fiber internet provider that serves several counties in eastern Georgia. The other providers on this list are member-owned internet cooperatives that serve populations in rural and smaller urban areas in parts of the South.
Fastest regional internet providers, April 1, 2022–April 1, 2023
| Rank | Provider | Integrated speed score (ISS) | Max advertised speed | Service area | Order online |
|---|---|---|---|---|---|
| #1 | Altamaha Fiber | 250.78 | 2,500Mbps | Parts of east central Georgia | View Plans |
| #2 | WeLink | 271.59 | 1,000Mbps | Phoenix, AZ; Las Vegas, NV; Henderson, NV; Tucson, AZ; Washington, DC | View Plans |
| #3 | FlashFiber | 243.09 | 2,000Mbps | Lawrence and Moulder Counties, AL | View Plans |
| #4 | Wyyerd Fiber | 258.33 | 2,000Mbps | Cherokee County, Texas | View Plans |
| #5 | Ting Fiber | 230.26 | 1,000Mbps | 13 cities in California, Colorado, Idaho, Maryland, North Carolina, and Virginia | View Plans |
*Data effective 5/8/2023. Data taken from internet user results conducted on HighSpeedInternet.com’s speed test between January 9, 2022 and January 9, 2023. Not all speeds and packages available in all areas and are subject to change. The weighted speed score is not an actual internet speed.
The impressively high scores of all these providers makes clear that local and regional internet providers are fast becoming important players in the internet world. While larger internet providers may be able to deliver lower prices and more promos, local internet companies increasingly have a footprint in underserved areas, delivering faster speeds along with personalized customer service.
Pro tip:
Take our speed test to see what kind of bandwidth you have at home. You might be better off with a faster plan.

Looking for an easy way to test and track your internet speed on your phone?
Download our free, easy-to-use speed test app for quick and reliable results.


Which internet providers advertise the fastest speeds?
| Provider | Max speed | Price for fastest plan | Learn more about speeds providers offer |
|---|---|---|---|
| AT&T | 5,000Mbps | $180.00/mo.* | |
| Ziply | 10,000Mbps | $300.00/mo.† | View Plans |
| Frontier | 5,000Mbps | $154.99/mo.‡ | View Plans |
| Optimum | Up to 5,000Mbps | $180.00/mo.††† | View Plans |
| Verizon | Up to 2,300Mbps | $119.99/mo.‡‡‡# | |
| Google Fiber | 2,000Mbps | $100.00/mo.§ | |
| Windstream | 2,000Mbps | $169.99/mo.†††† | View Plans |
| Xfinity | 1,200Mbps | $80.00/mo.║ | View Plans |
| Mediacom | 1,000Mbps | $69.99/mo.** | View Plans |
| MetroNet | 5,000Mbps | $120.00/mo.†† | View Plans |
| Cox | Up to 1,000Mbps | $99.99/mo.‡‡ | View Plans |
| Spectrum | Up to 1,000Mbps | $89.99/mo.§§ | View Plans |
| CenturyLink | 940Mbps | $70.00/mo.║║ | |
| Astound Broadband | Up to 940Mbps | $50.00-$60.00/mo.*** | |
| Starlink | Up to 100Mbps | $110.00/mo.§§§ | View Plans |
| ViaSat | 100Mbps | $169.99/mo.║║║ | |
| HughesNet | 15-50Mbps | $49.99–$174.99/mo.**** |
See disclaimer at bottom of page.
A growing number of fiber and cable internet providers have boosted their internet plans to new multigigabit speeds—including speed tiers reaching all the way up to 5,000Mbps.
Here’s a breakdown of which providers unveiled multi-gig plans and when:
- Xfinity first introduced a 2,000Mbps Gigabit Pro plan in 2015. The provider upped its Gigabit Pro plan to 3,000Mbps in November 2021.
- Google Fiber announced a trial run for its 2,000Mbps speed tier in September 2020. It will introduce 5,000Mbps and 8,000Mbps plans in early 2023.
- AT&T and Ziply Fiber both unveiled 2,000Mbps and 5,000Mbps plans in the first months of 2022.
- Frontier introduced a 2,000Mbps plan in early 2022. It announced a 5,000Mbps plan in January 2023.
- Ziply Fiber bumped its top speed to 10,000Mbps in April 2023
Of course, most internet users don’t get gigabit speeds, most people don’t need those kinds of speeds. In fact, your home Wi-Fi doesn’t often reach the top speeds advertised by your internet plan. We discuss this issue further in the next section of this report.
Pro tip:
Sometimes you don’t need the fastest internet connection just because you can get it. Take a look at our “How Much Internet Speed Do I Need?” tool to get an idea of how much bandwidth is right for your household.
Part 2: Is it time to update the FCC’s broadband standards to a minimum speed of 100Mbps?

With the internet increasingly a key part of everyday life, the federal government has pushed for internet service providers to do better. In the summer of 2022, Jessica Rosenworcel—the chairwoman of the Federal Communications Commission—put out an official call to raise the federal speed minimums for broadband internet.
Currently, the FCC (the federal agency tasked with regulating internet policy) defines broadband internet as any connection with a minimum of 25Mbps download speeds and 3Mbps upload speeds. But in July 2022, citing the increased demand for fast internet in the wake of the COVID-19 pandemic, Rosenworcel called to raise that minimum to 100Mbps download speeds and 20Mbps upload speeds.1
Are American internet providers prepared to consistently deliver on those proposed benchmarks? We took a look at five years’ worth of speed-test data to see.
Average download speeds in 2022 were over 100Mbps for the first time
In 2022, the average download speed for internet users in the United States was 111.2Mbps, according to our speed test.
That’s a massive jump from five years ago, when average download speeds were at 41.5Mbps. That means download speeds have gone up by 168% in just five years, with more netizens getting 100Mbps speeds or faster than ever before.
How much have internet speeds improved since 2018?
| Year | Average download speeds (all tests) |
|---|---|
| 2018 | 41.5Mbps |
| 2019 | 51.0Mbps |
| 2020 | 81.9Mbps |
| 2021 | 97.5Mbps |
| 2022 | 111.2Mbps |
*Data effective 1/23/2023. Data taken from internet user results conducted on HighSpeedInternet.com’s speed test.
The jump in speeds makes sense. Compared to the days before the COVID-19 pandemic, millions more people today have to share Wi-Fi with others while working and studying from home. Common netizens also do a lot more daily tasks online now, including everything from online gaming to medical checkups.
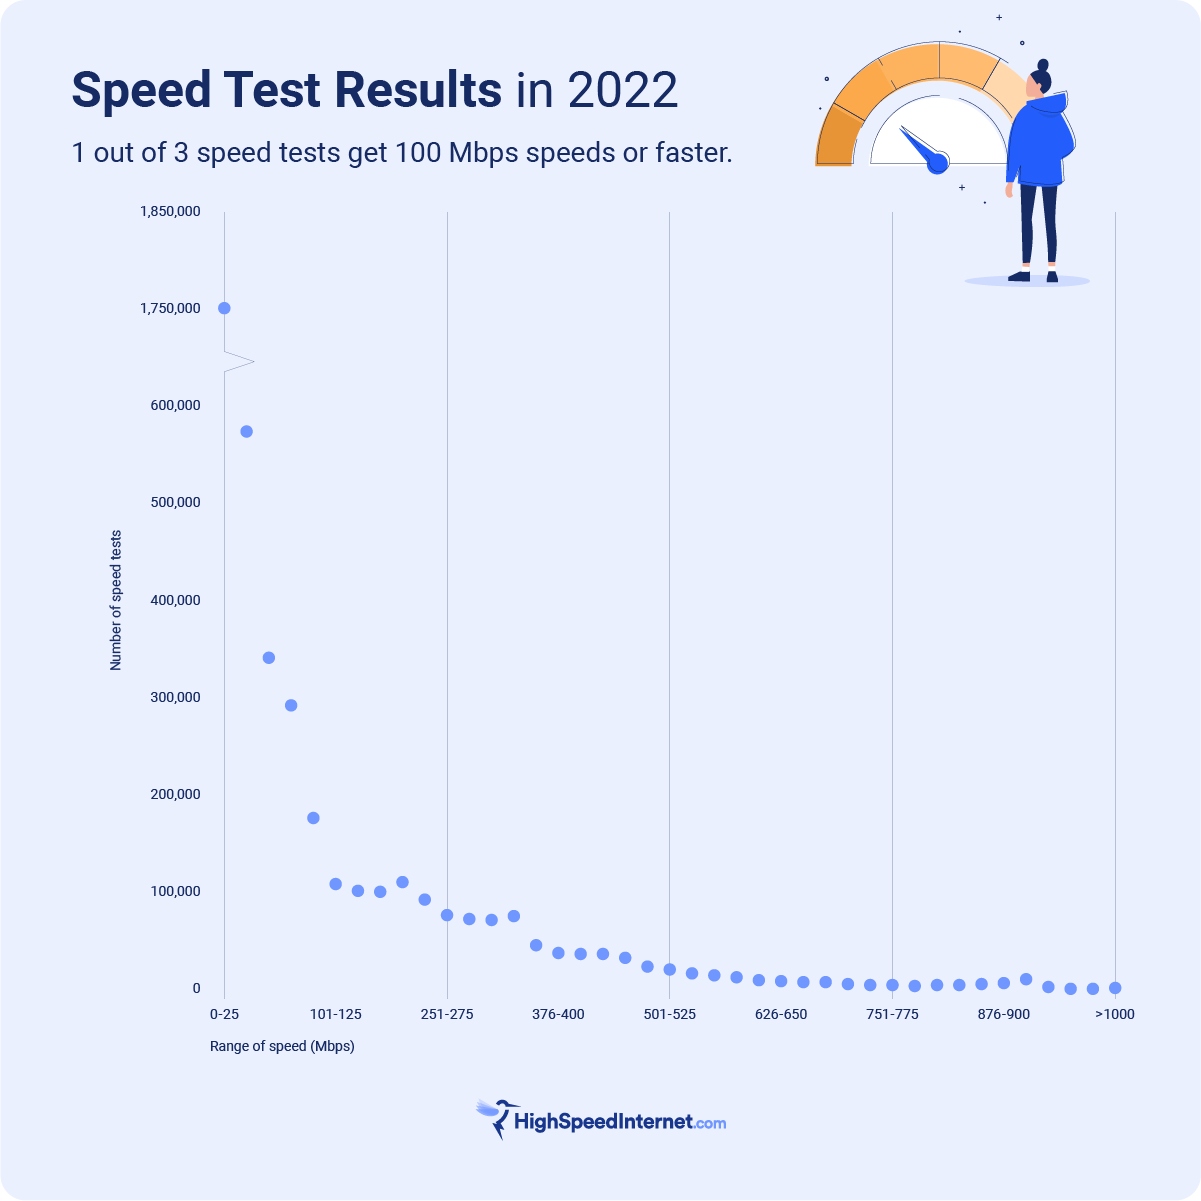
But only one out of three US-based internet users gets 100Mbps speeds or faster
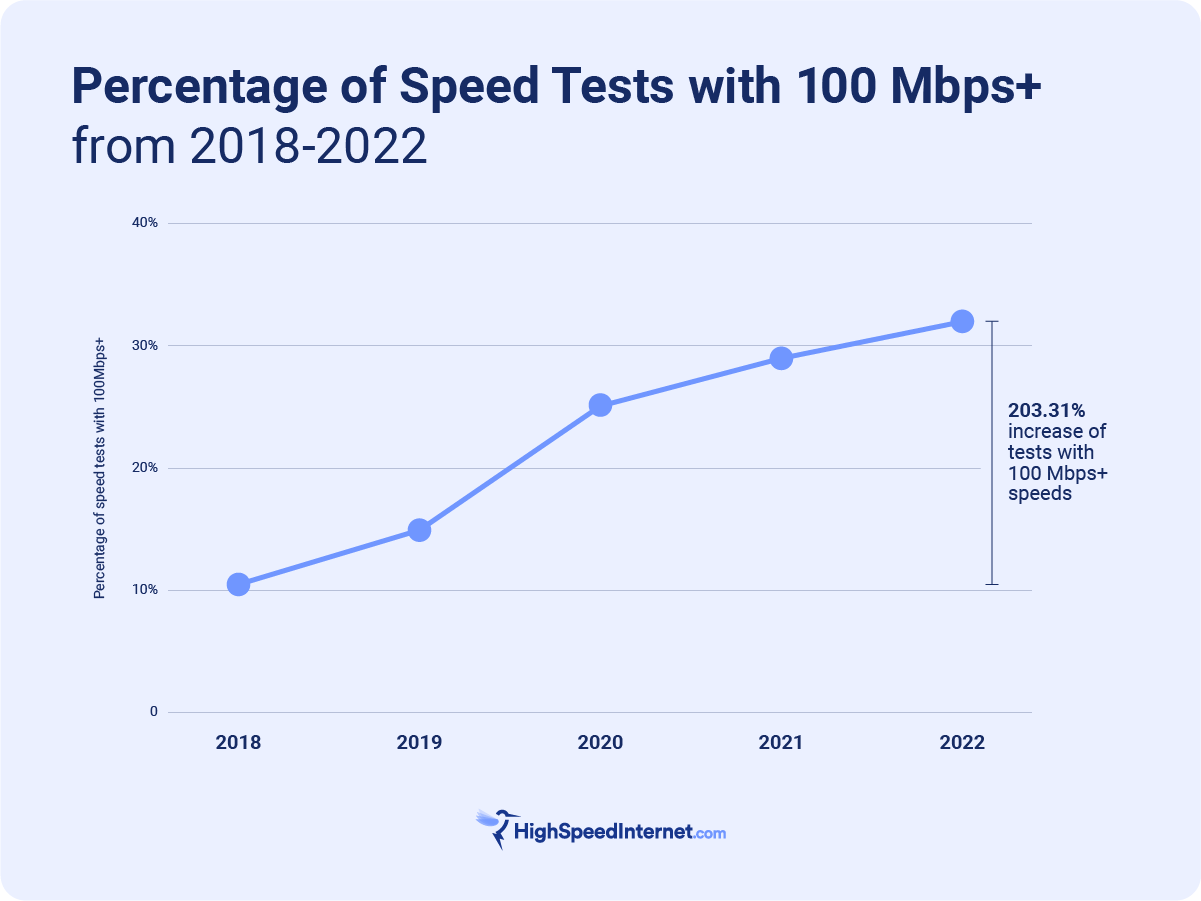
Despite the major gains that internet providers have made in recent years, the majority of Americans still don’t get speeds of 100Mbps or faster. According to our speed test data, 32% of users get download speeds of 100Mbps or faster.
That’s three times more users than in 2018, when just over 10% of internet users got speeds that fast on our speed test. Clearly there is still a lot of room for internet providers to improve their speeds before most Americans meet the proposed FCC benchmarks.
Interestingly, as the chart below shows, our data suggests that a large number of users are still coping with download speeds of 25Mbps or slower. However, enough users get speeds close to 100 Mbps or over that number that it drives up the average. Also, while very few internet users get speeds of 500Mbps or faster, those cases also bring up the overall average.
How many internet users get 100Mbps speeds or faster?
| Year | Total # of speed tests (all internet providers) | % of tests with download speeds of 100Mbps or faster | % increase from previous year |
|---|---|---|---|
| 2018 | 63,0271 | 10.55% | Data not available |
| 2019 | 1,694,892 | 14.99% | up 42.08% |
| 2020 | 3,280,050 | 25.22% | up 68.24% |
| 2021 | 2,980,159 | 29.02% | up 15.06% |
| 2022 | 4,380,518 | 32.00% | up 10.26% |
According to our data, users saw a particularly drastic rise in speeds between the years of 2018–2019 and 2019–2020. These figures aren’t surprising, considering the pandemic was in full swing by March 2020, requiring an unprecedented number of internet users to seek out faster speeds to support remote work and school.
The rise in the number of users with 100Mbps or faster speeds tapered off in 2021 and 2022. But if you filter the data by specific providers, the rise of users with 100Mbps speeds in much more drastic terms.
Which internet providers deliver 100Mbps+ speeds to the most customers?
| Internet provider | % of users with 100Mbps download speeds or faster in 2018 | % of users with 100Mbps download speeds or faster in 2022 | % increase, 2018 vs. 2022 |
|---|---|---|---|
| Astound Broadband | 30.70% | 53.78% | up 75.17% |
| AT&T | 36.79% | 52.27% | up 42.07% |
| CenturyLink | 14.05% | 34.27% | up 143.91% |
| Cox | 20.26% | 59.12% | up 191.80% |
| Frontier | 13.67% | 55.88% | up 308.77% |
| Google Fiber | 37.38% | 60.02% | up 60.56% |
| Mediacom | 14.01% | 55.62% | up 297.0% |
| MetroNet | 39.58% | 60.84% | up 53.71% |
| Optimum | 26.62% | 60.43% | up 127.00% |
| Spectrum | 21.00% | 59.43% | up 183% |
| T-Mobile | N/A* | 40.14% | up 172.69% (2019–2022) |
| Verizon | 20.38% | 46.67% | up 96.67% |
| Windstream | 8.30% | 35.31% | up 325.42% |
| Xfinity | 33.01% | 59.69% | up 80.82% |
*14.72% in 2019 (the first year T-Mobile 5G Home Internet is available)
Our speed test results suggest that fiber internet providers have seen some of the biggest gains in speeds. Windstream and Frontier—which both offer a mix of DSL and fiber-optic internet services—saw the biggest increase in users with 100Mbps speeds between 2018 and 2022. These higher numbers reflect how fiber internet providers in general have pivoted away from antiquated services like DSL in favor of building up their fiber networks.
Cable providers like Mediacom and Cox have also shown drastic rises in the number of users with 100Mbps speeds or faster.
More notably, T-Mobile showed an increase of 173% between 2019 and 2022. T-Mobile launched its 5G Home Internet service in 2019, and availability has vastly expanded since then—a development that has earned the provider top ratings in our annual customer satisfaction survey.
Interestingly, some fiber internet providers (notably Google Fiber, MetroNet, and AT&T) showed much smaller gains. However, that’s because these carriers were already delivering 100Mbps speeds or faster to a large number of users to begin with. In 2018, well over a third of Google Fiber and AT&T’s speed tests were showing speeds of 100Mbps or greater. Those numbers have only grown in the years since, with as much as 60% of the providers’ speed-test users now getting speeds in that range.
100Mbps+ speeds—satellite internet providers
| Satellite providers | 2018 | 2022 | % increase, 2018 vs. 2022 |
|---|---|---|---|
| HughesNet | 0.07% | 4.81% | up 6,771.42% |
| Viasat | 0.13% | 4.60% | up 3,438% |
| Starlink | N/A (20.88% in 2020)* | 17.99% | down 13.84% (2020 vs. 2022) |
*Starlink launched its beta service in 2020, so that was the first year Starlink data was available on our speed test
Satellite internet providers are a different story. On the whole, very few satellite internet users get speeds of 100Mbps or faster because satellite bandwidth itself is extremely limited.
Starlink, the much-talked-about satellite internet service run by Elon Musk’s SpaceX company, gets the highest number of users with 100Mbps download speeds or faster. Tellingly, though, Starlink actually saw a decrease in the number of users getting these speeds between 2020 and 2022—possibly due to the fact that the provider is expanding its availability and facing new challenges in serving more users.
Do you really need 100Mbps speeds? For many, the answer is yes
While you can do a lot of things online with a tiny amount of bandwidth, most internet users end up needing 100Mbps speeds or more to serve as a buffer as they multitask online and share their Wi-Fi connection with others. The more devices, activities, and users you have going at once, the faster your speeds need to be.
A 100Mbps internet plan isn’t the fastest you can get—it’s pretty much the average. But for many users, 100Mbps download speeds provide a sufficient amount of breathing room to handle bandwidth-taxing tasks with minimal slowdowns or technical glitches. By comparison, 25Mbps download speeds are better suited for someone who lives alone or in a small household and spends less time streaming or making video calls.
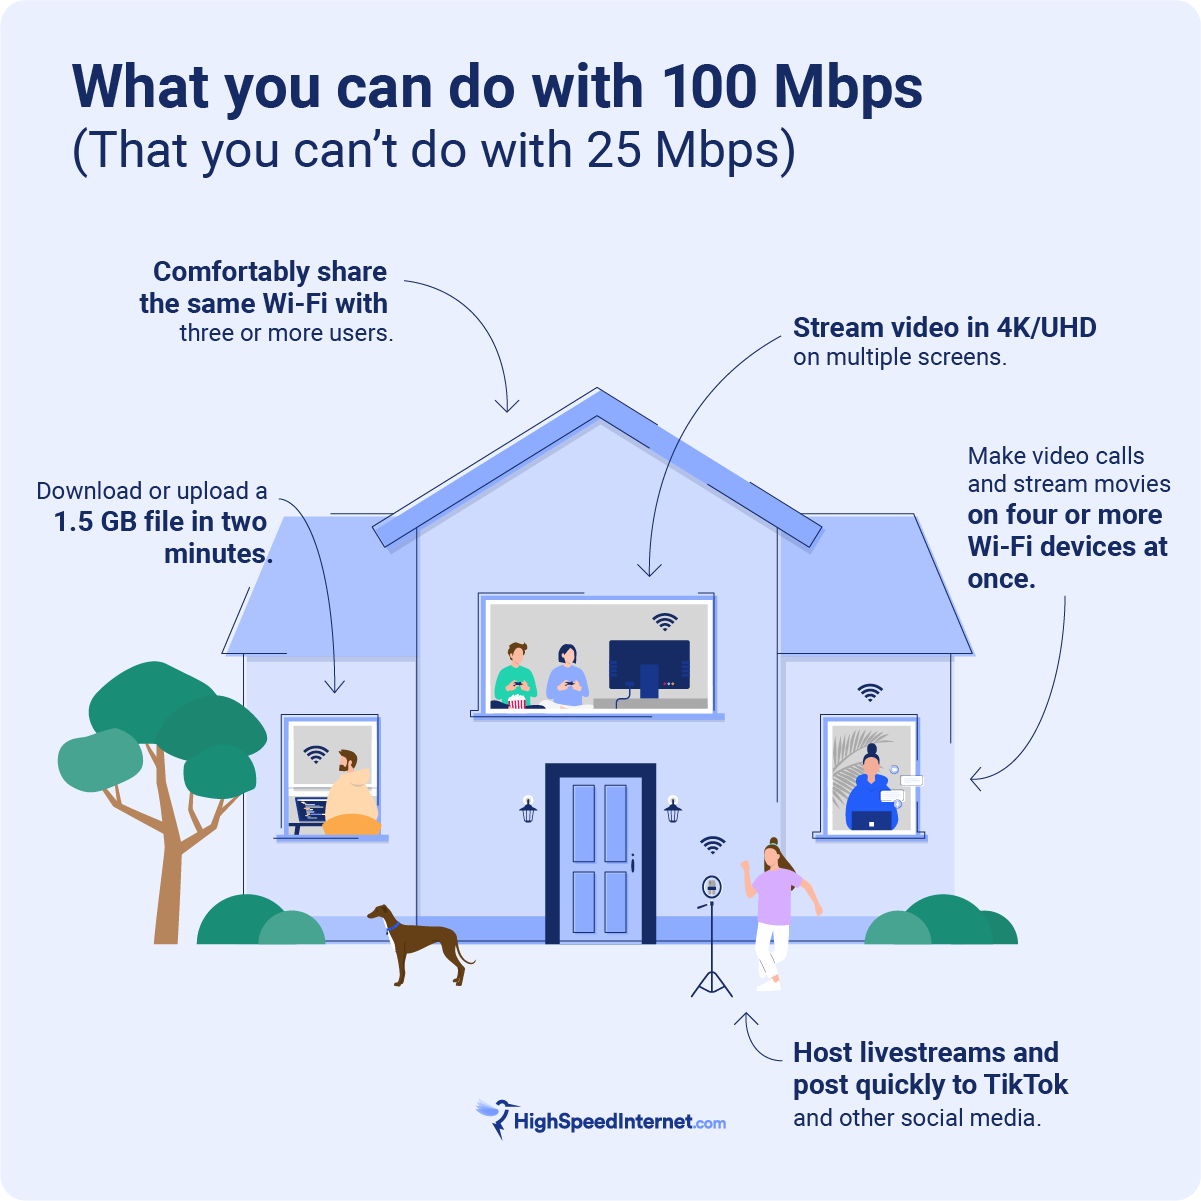
What can you do with 100Mbps that you can’t do with 25Mbps?
- Comfortably share the same Wi-Fi with three or more users
- Make video calls and stream movies on four or more Wi-Fi devices at once
- Stream video in 4K/UHD on multiple screens
- Download or upload a 1.5GB file in two minutes
- Host livestreams
You should also consider the fact that most internet plans that advertise 100Mbps speeds tend to deliver slower speeds on a daily basis, due to limitations of your modem and router, the number of users on your Wi-Fi, and a range of other factors. So even if you’re paying for what you think is a 100Mbps plan, you likely are getting less out of your connection.
What’s the fastest internet plan you should buy?
The fastest internet plan you should buy is 1,000Mbps. Anything faster isn’t necessary for the majority of internet users—and high prices and limited availability make some of these plans out of reach anyway. Take a look at our “How much internet speed do I need?” tool to get a proper idea of the bandwidth you want at home.
According to our data, most people have much slower download speeds than 1,000Mbps. On our speed test in 2022, only 3% of users saw download speeds of 500Mbps or faster.
How many internet users get 500Mbps download speeds or faster?
| Year | Total # speed tests (all providers) | # of speed tests with 500Mbps download speeds or faster | % of speed tests with 500Mbps download speeds or faster |
|---|---|---|---|
| 2018 | 630,271 | 1,456 | 0.23% |
| 2019 | 1,694,892 | 4,845 | 0.28% |
| 2020 | 3,280,050 | 37,239 | 1.13% |
| 2021 | 2,980,159 | 62,012 | 2.08% |
| 2022 | 4,380,518 | 143,949 | 3.28% |
In 2018, the number of speed tests that hit 500Mbps or faster was less than 1%. As our data shows, the number of users with those speeds has gone up significantly over the past five years. And yet, internet users with 500Mbps speeds or faster make up a tiny minority of our total speed tests. Our data shows that it’s much more common to see speeds in the range of 25–99Mbps or 100–499Mbps.
Methodology: How HighSpeedInternet.com made the Fastest Internet Providers report
We measure providers’ internet speeds using our own internet speed test. Millions of internet users take our test each year, and we recalculate the results every three months to generate an integrated speed score (ISS) for the top-performing internet providers.
We calculate the ISS by adding 90% of a provider’s average download speed to 10% of the provider’s average upload speed, a blend that reflects the relative importance of these different speeds to a user’s needs.
Most internet providers advertise only download speed as the standard-bearer for internet speed as a whole. We factor in upload speeds as well because they’re important to consider as internet users increasingly depend on upload bandwidth for Zoom, livestreams, and social media.
For this edition of our report, we also pulled data from 17 major internet service providers going back to 2018 in order to analyze internet speed trends over time. For each year, we looked at the number of tests that fell into specific speed ranges—25–99Mbps, 100–499Mbps, 500–999Mbps, and 1,000Mbps and faster.
Fastest internet providers—the raw data
The tables below offer a sampling of some of the raw data we used to calculate the fastest internet providers. There are a lot of ways to look at the fastest internet providers—and we chose these data points to show an accurate picture of how speed works, rather than simply relying on advertised numbers from providers.
Fastest average download speeds, major internet providers, January 9, 2022–January 9, 2023
| Provider | Avg. download speed* | Avg. upload speed* | # of tests performed |
|---|---|---|---|
| Google Fiber | 165.87Mbps | 221.22Mbps | 10,229 |
| Xfinity | 165.45Mbps | 82.36Mbps | 978,612 |
| Cox | 154.73Mbps | 74.37Mbps | 76,692 |
| Verizon | 153.12Mbps | 176.81Mbps | 158,389 |
| MetroNet | 145.52Mbps | 183.36Mbps | 10,519 |
*Data effective 1/25/23. Data taken from internet user results conducted on HighSpeedInternet.com’s speed test between January 9, 2022 and January 9, 2023. Not all speeds and packages available in all areas and are subject to change.
Fastest average download speeds, regional internet providers, January 9, 2022–January 9, 2023
| Provider | Avg. download speed* | Avg. upload speed* | # of tests performed |
|---|---|---|---|
| WeLink | 281.52Mbps | 182.33 | 121 |
| Buzz Broadband | 265.01Mbps | 409.31 | 160 |
| Cherokee County Electric Cooperative Association | 246.14Mbps | 190.83 | 161 |
| Altamaha Fiber | 244.51Mbps | 307.34 | 119 |
| FlashFiber | 242.32Mbps | 250.10 | 247 |
*Data effective 1/25/23. Data taken from internet user results conducted on HighSpeedInternet.com’s speed test between January 9, 2022 and January 9, 2023. Not all speeds and packages available in all areas and are subject to change.
We used these average download speeds to help generate the integrated speed scores for the above sections on the fastest national internet providers and the fastest regional internet providers of the past 12 months. Some of the providers ended up ranking higher because we also factored in average upload speeds to generate our integrated speed score.
Percentage of internet users with speeds of 100 Mbps or faster
| Internet provider | Speed range (Mbps) | % of users in 2018 | % of users in 2019 | % of users in 2020 | % of users in 2021 | % of users in 2022 | % improved (2018 vs. 2022) |
|---|---|---|---|---|---|---|---|
| Astound Broadband | 1,000 and up | 0 | 0 | 0 | 0 | 0.02 | |
| 500–999 | 0.8 | 1.11 | 2.79 | 3.98 | 5.69 | ||
| 100–499 | 29.9 | 31.95 | 43.77 | 44.63 | 48.07 | ||
| Total % | 30.7 | 33.06 | 46.56 | 48.61 | 53.78 | up 75.17% |
| Internet provider | Speed range (Mbps) | % of users in 2018 | % of users in 2019 | % of users in 2020 | % of users in 2021 | % of users in 2022 | % improved (2018 vs. 2022) |
|---|---|---|---|---|---|---|---|
| AT&T | 1,000 and up | 0 | 0 | 0 | 0.06 | 0.23 | |
| 500–999 | 2.4 | 2.25 | 3.85 | 5.83 | 8.42 | ||
| 100–499 | 34.39 | 43.36 | 49.76 | 46.04 | 43.62 | ||
| Total % | 36.79 | 45.61 | 53.61 | 51.93 | 52.27 | up 42.07% |
| Internet provider | Speed range (Mbps) | % of users in 2018 | % of users in 2019 | % of users in 2020 | % of users in 2021 | % of users in 2022 | % improved (2018 vs. 2022) |
|---|---|---|---|---|---|---|---|
| CenturyLink | 1,000 and up | 0 | 0 | 0.01 | 0 | 0 | |
| 500–999 | 2.01 | 1.24 | 2.60 | 3.30 | 4.95 | ||
| 100–499 | 12.04 | 21.12 | 22.97 | 24.55 | 29.32 | ||
| Total % | 14.05 | 22.36 | 25.58 | 27.85 | 34.27 | up 143.91% |
| Internet provider | Speed range (Mbps) | % of users in 2018 | % of users in 2019 | % of users in 2020 | % of users in 2021 | % of users in 2022 | % improved (2018 vs. 2022) |
|---|---|---|---|---|---|---|---|
| Cox | 1,000 and up | 0 | 0 | 0 | 0 | 0.02 | |
| 500–999 | 0.22 | 0.40 | 2.96 | 4.68 | 7.38 | ||
| 100–499 | 20.04 | 26.94 | 46.17 | 48.64 | 51.72 | ||
| Total % | 20.26 | 27.34 | 49.13 | 53.32 | 59.12 | up 191.80% |
| Internet provider | Speed range (Mbps) | % of users in 2018 | % of users in 2019 | % of users in 2020 | % of users in 2021 | % of users in 2022 | % improved (2018 vs. 2022) |
|---|---|---|---|---|---|---|---|
| Frontier | 1,000 and up | 0 | 0 | 0 | 0.01 | 0.07 | |
| 500–999 | 0.08 | 0.25 | 2.13 | 3.58 | 8.78 | ||
| 100–499 | 13.59 | 25.48 | 39.77 | 44.13 | 47.10 | ||
| Total % | 13.67 | 25.73 | 41.90 | 47.71 | 55.88 | up 308.77% |
| Internet provider | Speed range (Mbps) | % of users in 2018 | % of users in 2019 | % of users in 2020 | % of users in 2021 | % of users in 2022 | % improved (2018 vs. 2022) |
|---|---|---|---|---|---|---|---|
| Google Fiber | 1,000 and up | 0 | 0 | 0 | 0.42 | 0.32 | |
| 500–999 | 3.06 | 3.21 | 5.13 | 6.70 | 8.37 | ||
| 100–499 | 34.32 | 35.43 | 54.39 | 50.52 | 51.33 | ||
| Total % | 37.38 | 38.64 | 59.52 | 57.64 | 60.02 | up 60.56% |
| Internet provider | Speed range (Mbps) | % of users in 2018 | % of users in 2019 | % of users in 2020 | % of users in 2021 | % of users in 2022 | % improved (2018 vs. 2022) |
|---|---|---|---|---|---|---|---|
| HughesNet | 1,000 and up | 0 | 0 | 0 | 0 | 0 | |
| 500–999 | 0 | 0 | 0 | .74 | .14 | ||
| 100–499 | 0.07 | 4.49 | 11.19 | 13.3 | 4.67 | ||
| Total % | 0.07 | 4.49 | 11.19 | 14.04 | 4.81 | up 6771.42% |
| Internet provider | Speed range (Mbps) | % of users in 2018 | % of users in 2019 | % of users in 2020 | % of users in 2021 | % of users in 2022 | % improved (2018 vs. 2022) |
|---|---|---|---|---|---|---|---|
| Mediacom | 1,000 and up | 0 | 0 | 0 | 0.01 | 0.01 | |
| 500–999 | 0.11 | 0.28 | 1.82 | 3.62 | 4.35 | ||
| 100–499 | 13.9 | 20.09 | 35.09 | 42.57 | 51.26 | ||
| Total % | 14.01 | 20.37 | 36.91 | 46.20 | 55.62 | up 297.0% |
| Internet provider | Speed range (Mbps) | % of users in 2018 | % of users in 2019 | % of users in 2020 | % of users in 2021 | % of users in 2022 | % improved (2018 vs. 2022) |
|---|---|---|---|---|---|---|---|
| Metronet | 1,000 and up | 0 | 0 | 0 | 0 | 0.01 | |
| 500–999 | 1.24 | 0.79 | 2.68 | 3.53 | 3.90 | ||
| 100–499 | 38.34 | 37.54 | 49.57 | 54.66 | 56.93 | ||
| Total % | 39.58 | 38.33 | 52.25 | 58.19 | 60.84 | up 53.71% |
| Internet provider | Speed range (Mbps) | % of users in 2018 | % of users in 2019 | % of users in 2020 | % of users in 2021 | % of users in 2022 | % improved (2018 vs. 2022) |
|---|---|---|---|---|---|---|---|
| Optimum | 1,000 and up | 0 | 0 | 0 | 0 | 0.01 | |
| 500–999 | 0.04 | 0.1 | 1.03 | 3.21 | 5.09 | ||
| 100–499 | 26.58 | 32.12 | 47.5 | 51.36 | 55.33 | ||
| Total % | 26.62 | 32.22 | 48.53 | 54.57 | 60.43 | up 127.00% |
| Internet provider | Speed range (Mbps) | % of users in 2018 | % of users in 2019 | % of users in 2020 | % of users in 2021 | % of users in 2022 | % improved (2018 vs. 2022) |
|---|---|---|---|---|---|---|---|
| Spectrum | 1,000 and up | 0 | 0 | 0 | 0 | 0 | |
| 500–999 | 0.03 | 0.08 | 0.44 | 0.69 | 2.19 | ||
| 100–499 | 20.97 | 26.27 | 43.94 | 49.52 | 57.24 | ||
| Total % | 21 | 26.35 | 44.38 | 50.21 | 59.43 | up 183% |
| Internet provider | Speed range (Mbps) | % of users in 2018 | % of users in 2019 | % of users in 2020 | % of users in 2021 | % of users in 2022 | % improved (2018 vs. 2022) |
|---|---|---|---|---|---|---|---|
| Starlink | 1,000 and up | N/A | N/A | 0 | 0 | 0 | |
| 500–999 | N/A | N/A | 0 | 0.03 | 0.05 | ||
| 100–499 | N/A | N/A | 20.88 | 23.68 | 17.94 | ||
| Total % | N/A | N/A | 20.88 | 23.71 | 17.99 | down 13.84% (2020 vs. 2022) |
| Internet provider | Speed range (Mbps) | % of users in 2018 | % of users in 2019 | % of users in 2020 | % of users in 2021 | % of users in 2022 | % improved (2018 vs. 2022) |
|---|---|---|---|---|---|---|---|
| T-Mobile | 1,000 and up | N/A | 0 | 0 | 0 | 0 | |
| 500–999 | N/A | 0.02 | 0.09 | 0.36 | 0.53 | ||
| 100–499 | N/A | 14.7 | 20.44 | 26.97 | 39.61 | ||
| Total % | N/A | 14.72 | 20.53 | 27.33 | 40.14 | up 172.69% |
| Internet provider | Speed range (Mbps) | % of users in 2018 | % of users in 2019 | % of users in 2020 | % of users in 2021 | % of users in 2022 | % improved (2018 vs. 2022) |
|---|---|---|---|---|---|---|---|
| Verizon | 1,000 and up | 0 | 0 | 0 | 0.01 | 0.02 | |
| 500–999 | 1.44 | 1.07 | 3.14 | 4.44 | 6.1 | ||
| 100–499 | 18.94 | 22.66 | 34.31 | 38.29 | 40.55 | ||
| Total % | 20.38 | 23.73 | 37.45 | 42.74 | 46.67 | up 96.67% |
| Internet provider | Speed range (Mbps) | % of users in 2018 | % of users in 2019 | % of users in 2020 | % of users in 2021 | % of users in 2022 | % improved (2018 vs. 2022) |
|---|---|---|---|---|---|---|---|
| Viasat | 1,000 and up | 0 | 0 | 0 | 0 | 0 | |
| 500–999 | 0 | 0.16 | 0 | 0.53 | 0.51 | ||
| 100–499 | 0.13 | 3.79 | 5.3 | 4.89 | 4.09 | ||
| Total % | 0.13 | 3.95 | 5.3 | 5.42 | 4.6 | up 3438% |
| Internet provider | Speed range (Mbps) | % of users in 2018 | % of users in 2019 | % of users in 2020 | % of users in 2021 | % of users in 2022 | % improved (2018 vs. 2022) |
|---|---|---|---|---|---|---|---|
| Windstream | 1,000 and up | 0 | 0 | 0 | 0.01 | 0 | |
| 500–999 | 0.59 | 0.3 | 0.85 | 1.95 | 4.4 | ||
| 100–499 | 7.71 | 11.43 | 17.59 | 23.06 | 30.91 | ||
| Total % | 8.3 | 11.73 | 18.44 | 25.02 | 35.31 | up 325.42% |
| Internet provider | Speed range (Mbps) | % of users in 2018 | % of users in 2019 | % of users in 2020 | % of users in 2021 | % of users in 2022 | % improved (2018 vs. 2022) |
|---|---|---|---|---|---|---|---|
| Xfinity | 1,000 and up | 0 | 0 | 0 | 0.02 | 0.04 | |
| 500–999 | 0.3 | 0.55 | 2.49 | 5.43 | 8.25 | ||
| 100–499 | 32.71 | 38.89 | 47.65 | 48.49 | 51.4 | ||
| Total % | 33.01 | 39.44 | 50.14 | 53.94 | 59.69 | up 80.82% |
Sources
- Jessica Rosenworcel, Federal Communications Commission, “Chairwoman Rosenworcel Proposes to Increase Minimum Broadband Speeds and Set Gigabit Future Goal,” Published July 15, 2022. Accessed January 30, 2023.
- Federal Communications Commission, “2015 Broadband Progress Report,” Published February 4, 2015. Accessed January 30, 2023.
- Jonathan Schwantes, Consumer Reports, “Broadband Pricing: What Consumer Reports Learned from 22,000 Internet Bills,” pg. 27, Fig 3.9, Published November 17, 2022. Accessed February 1, 2023.
Fastest providers (top of page) disclaimer
Return to top of page.
*Plus taxes and fees. Upload/download speed and device streaming claims are based on maximum wired speeds. Actual Internet speeds are not guaranteed and may vary based on factors such as hardware and software limitations, latency, packet loss, etc.
†Price per month with Auto Pay & without select 5G mobile plans. Fios plan prices include taxes & fees
‡For 24 months. No term contract. Taxes not included. Includes $10/mo automatic payments and paperless billing discount.
§for 12 months with 1-yr. term agreement
║For 6 months. Offers available to new residential customers only and may not be combined with other offers. MetroNet reserves the right to revoke or modify offers at any time. Taxes, fees, and other terms apply. Select speeds and prices only available in certain areas.
Disclaimer
*Price after $5/mo Autopay & Paperless bill discount (w/in 2 bills). Plus taxes & fees. Monthly State Cost Recovery Charge in TX, OH, NV applies. Ltd. availability/areas.
†For new residential customers only. No annual contract required. Prices shown are before taxes and fees and require autopay and paperless billing. Standard month to month pricing.
‡w/ Auto Pay & Paperless Bill. Max wired speed 5000/5000. Wi-Fi, actual & average speeds vary. One-time charges apply. In select areas where available.
§Plus taxes and fees. Upload/download speed and device streaming claims are based on maximum wired speeds. Actual Internet speeds are not guaranteed and may vary based on factors such as hardware and software limitations, latency, packet loss, etc.
║For 24 months. No term contract. Includes $10/mo automatic payments and paperless billing discount. Taxes and equipment not included.
‡‡‡w/ Auto Pay. Available in select areas.
# Available in select areas only. Price per month with Auto Pay & without select 5G mobile plans. Fios plan prices include taxes & fees.
**For the first 12 months. Plus, activation, installation and monthly modem rental fees.
║ ║Speed may not be available in your area. Maximum download/upload speed of up to 940 Mbps via a wired connection. Paperless billing required. Taxes and fees apply. Offer details. Offer includes professional installation at customer’s eligible location.
††For 6 months. Offers available to new residential customers only and may not be combined with other offers. MetroNet reserves the right to revoke or modify offers at any time. Taxes, fees, and other terms apply. Select speeds and prices only available in certain areas.
‡‡for 12 months with 1-yr. term agreement
§§For 12 months when bundled. Limited time offer; subject to change; valid to qualified residential customers who have not subscribed to any services within the previous 30 days and who have no outstanding obligation to Charter. Spectrum Internet® Gig promotion price is $89.99/mo; standard rates apply after yr. 1. Taxes, fees and surcharges extra and subject to change during and after the promotional period; installation/network activation, equipment and additional services are extra.
***Regional price differences may apply. No contract required. 24 Month Internet Pricing. Equipment priced separately. Includes $5 discount for 12 months w/ ebill & autopay. Observed speeds may vary. Excludes surcharges and fees. New residential customers only.
Regional price differences may apply. 24 Month Internet Pricing. No contract required. Equipment priced separately. Includes $5 discount for 12 months w/ ebill & autopay. Experienced speeds may vary. New residential customers only.
Regional price differences may apply. for 12 months w/ ebill & autopay. Experienced speeds may vary. New residential customers only.
Author - Peter Holslin
Peter Holslin has more than a decade of experience working as a writer and freelance journalist. He graduated with a BA in liberal arts and journalism from New York City’s The New School University in 2008 and went on to contribute to publications like Rolling Stone, VICE, BuzzFeed, and countless others. At HighSpeedInternet.com, he focuses on covering 5G, nerding out about frequency bands and virtual RAN, and producing reviews on emerging services like 5G home internet. He also writes about internet providers and packages, hotspots, VPNs, and Wi-Fi troubleshooting.
Editor - Rebecca Lee Armstrong
Rebecca Lee Armstrong has more than six years of experience writing about tech and the internet, with a specialty in hands-on testing. She started writing tech product and service reviews while finishing her BFA in creative writing at the University of Evansville and has found her niche writing about home networking, routers, and internet access at HighSpeedInternet.com. Her work has also been featured on Top Ten Reviews, MacSources, Windows Central, Android Central, Best Company, TechnoFAQ, and iMore.
Related Posts